
Automotive
MSA and gauge R and R
Why a measurement is a process with its own variation, what repeatability and reproducibility separate, how to read a percentage study result, and why a gauge that passes on one tolerance fails on another.
Standards referencedAIAG MSAIATF 16949ISO 14253-1VDA 5ISO 10012
Every number on a control chart, a capability report and a PPAP was produced by a measurement, and a measurement is a process with its own variation. Until you know how much of the spread belongs to the gauge, you do not know how much belongs to the part.

Three sources, three different fixes
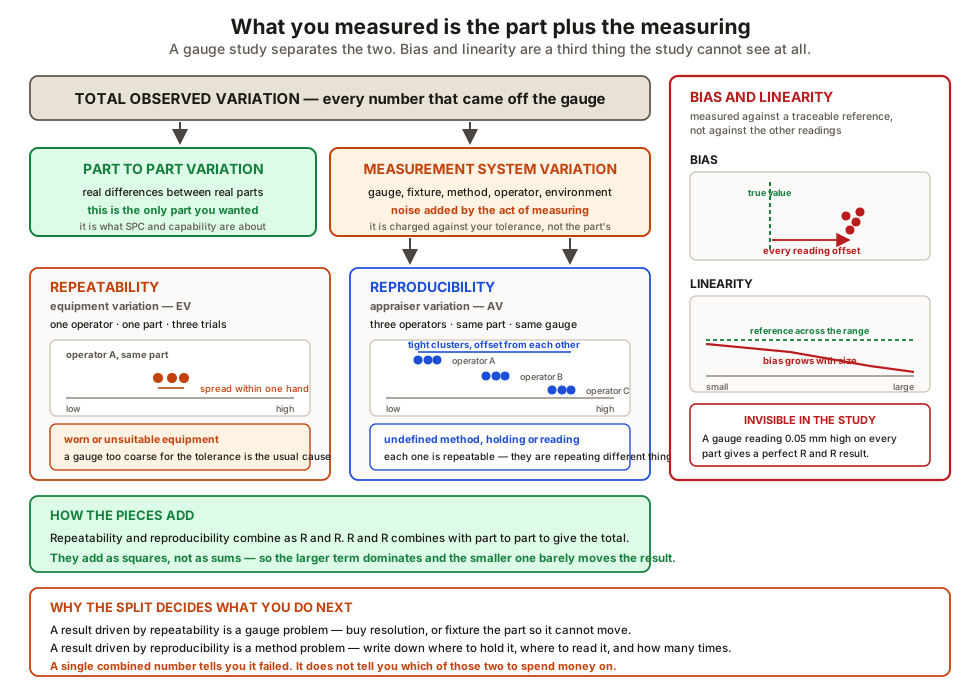
| Component | What it is | The fix |
|---|---|---|
| Repeatability | One operator, one part, repeated | The equipment |
| Reproducibility | Different operators, same parts | The method |
| Part-to-part | What is left | Nothing — this is the signal |
High reproducibility with low repeatability is the most informative result you can get: each operator is consistent and they disagree with each other. That is holding, locating or reading — not the instrument. A better micrometre will change nothing; a fixture and a written method will fix it.
Reading the percentage
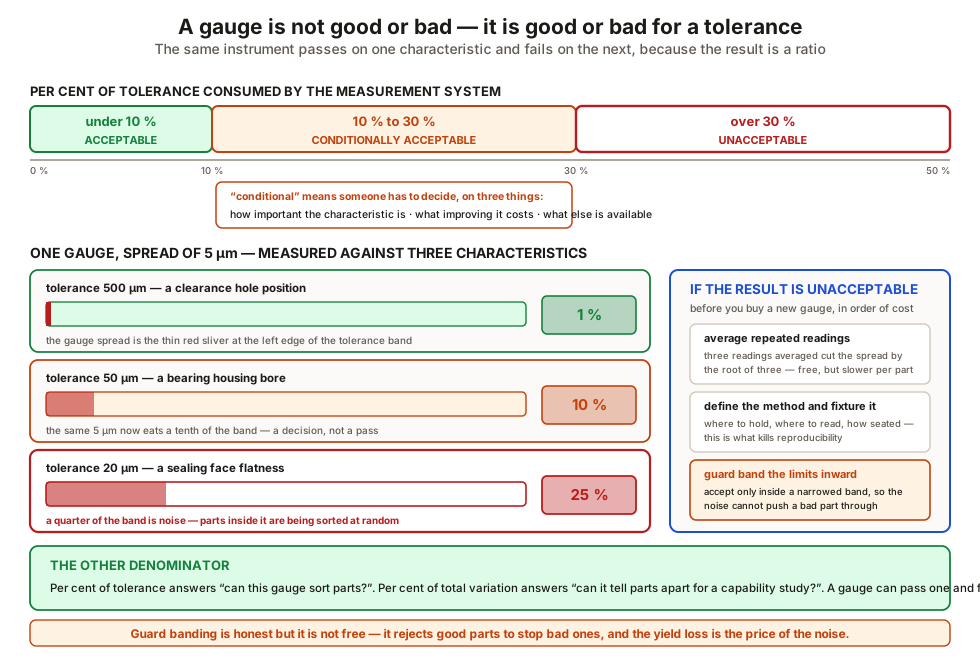
| Result | Verdict |
|---|---|
| Under 10 % | Acceptable |
| 10 – 30 % | Conditional — on importance, cost, and what else exists |
| Over 30 % | Unacceptable; the measurement is dominating what you see |
The middle band is conditional, not a pass. And the reason the result is a percentage is that adequacy is relative: a gauge with a five micrometre spread is excellent against a half millimetre tolerance and useless against twenty micrometres. The same instrument genuinely passes on one characteristic and fails on the next.
What the study cannot see
An R and R study measures spread. It is blind to a systematic offset, because a bias shifts every reading in the same direction and the numbers stay beautifully consistent.
| Property | Question | Needs |
|---|---|---|
| Bias | Is the average offset from truth? | A traceable reference |
| Linearity | Does that offset change across the range? | References at several values |
| Stability | Does it change over time? | Repeated checks on a master |
Linearity is the one that catches people out. A gauge can be accurate in the middle of its range and offset at the extremes — which is exactly where the parts you care about are. Checking bias at one convenient value near the middle proves nothing about the ends.
Attribute inspection: the kappa study
When the result is pass or fail rather than a number, there is no spread to analyse. Agreement is assessed instead: how consistently do inspectors agree with each other and with a known standard, beyond what chance alone would produce?
Visual inspection studied this way routinely returns agreement far below what anyone in the room expected, which is itself the argument for the prevention-based approach in error proofing and traceability.
Why this comes first
When there is no better gauge
Sometimes the result is unacceptable and nothing better exists at any sensible cost. There are legitimate responses:
- Average repeated readings — this reduces the random component by a known factor.
- Define the method — a fixture, a stated contact point, a written instruction. This attacks reproducibility directly.
- Guard band the acceptance limits inward per ISO 14253-1 — deliberately accepting that good parts will be rejected in order to stop bad parts being accepted. The same logic as checking fixtures and functional gauges.
Recording the limitation and carrying on is not on that list.
What to take away
- A measurement is a process with variation; the chart shows process plus gauge.
- Repeatability is the equipment; reproducibility is the method.
- Consistent operators who disagree with each other means fixture and method, not a new gauge.
- The result is a percentage because adequacy is relative to the tolerance.
- One gauge can pass on one characteristic and fail on the next.
- Under 10 % acceptable, 10–30 % conditional, over 30 % unacceptable.
- Part selection sets the denominator — span the real process range, sampled over time.
- An R and R study is blind to bias; that needs a traceable reference.
- Check linearity across the range, not at one comfortable value.
- Attribute inspection needs a kappa study, and usually disappoints.
- No better gauge? Average, fixture, guard band — and record the decision.
Check your understanding
10 questions. Nothing is recorded — this is just for you.