
Automotive
SPC and process capability
Why control limits are not specification limits, what common and special cause variation demand differently, the difference between Cp, Cpk, Pp and Ppk, and why tampering with a stable process makes it worse.
Standards referencedAIAG SPCIATF 16949ISO 7870-2ISO 22514-2VDA 4
Two numbers get confused more often than any others in manufacturing: the limits that come from the process and the limits that come from the drawing. They arrive from opposite directions, they answer different questions, and putting them on the same chart is how a good control tool becomes a source of unnecessary adjustment.

Control limits are not specification limits

| Comes from | Answers | |
|---|---|---|
| Control limits | The process data | What does this process do? |
| Specification limits | The design | What is required? |
Neither answers the other’s question. A process can be beautifully in control and entirely incapable, and it can be out of control while most parts happen to conform.
Common cause, special cause, and tampering
| Variation | Nature | Response |
|---|---|---|
| Common cause | Inherent, always present | Change the process |
| Special cause | An identifiable disturbance | Investigate and eliminate |
Rational subgroups
A subgroup should be chosen so that variation within it is common cause only. Consecutive parts usually achieve this, because very little can change in that interval, and shifts then show up as variation between subgroups, which is what the chart is built to detect.
Sample across two machines into one subgroup and the within-subgroup variation inflates, the control limits widen, and the chart stops signalling anything. A chart that never signals looks reassuring and is worthless.
Reading more than the limits
Watching only for points outside the limits throws away most of the chart’s sensitivity. A sustained mean shift can occur with no point crossing a limit at all.
| Pattern | Suggests |
|---|---|
| Point beyond a control limit | A distinct event |
| Eight points one side of the centre line | A shift in the mean |
| Six points steadily rising or falling | Tool wear, thermal drift |
| Alternating sawtooth | Two streams mixed, or over-adjustment |
| Points hugging the centre line | Subgrouping or plotting problem |
The four indices
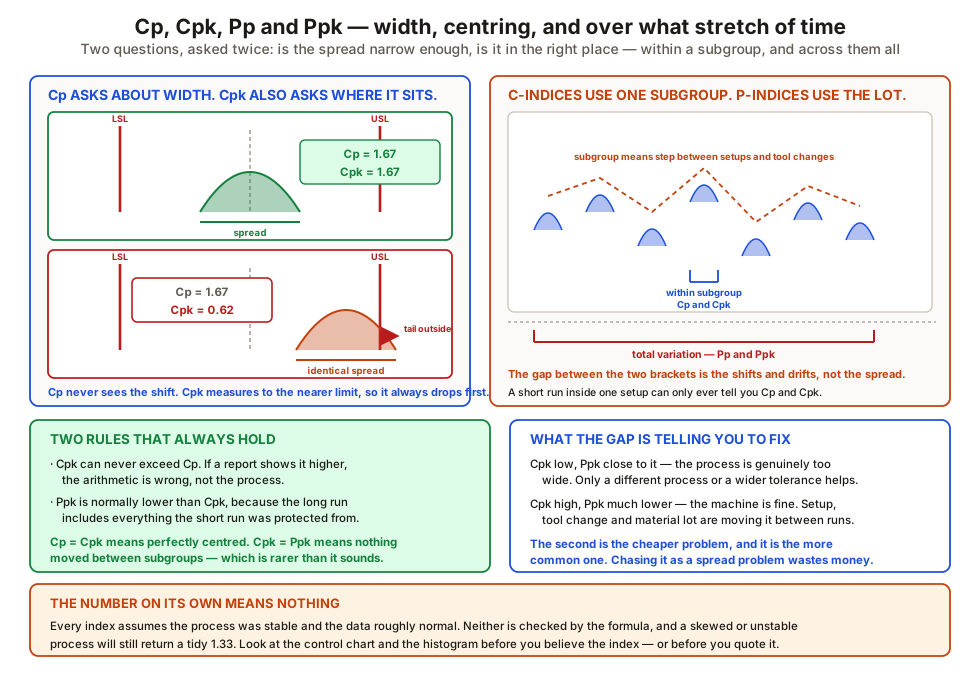
| Index | Uses | Accounts for centring |
|---|---|---|
| Cp | Within-subgroup (short-term) | No |
| Cpk | Within-subgroup (short-term) | Yes |
| Pp | Total (long-term) | No |
| Ppk | Total (long-term) | Yes |
Two relationships carry most of the diagnostic value:
- Cpk can never exceed Cp. A big difference between them means the process is off centre — and centring is usually the cheapest improvement available.
- A big gap between Cpk and Ppk means the process is capable moment to moment but not held over time. That points squarely at setup, tool change and material lot effects rather than inherent spread.
Variable beats attribute, when you can afford it
A variable chart shows the mean walking towards a limit while every part still conforms — which is the entire window in which prevention is possible.
An attribute chart shows nothing until parts start failing, because a pass or fail result throws away the information about how close to the limit the part was. By the time it signals, the opportunity has been spent.
Which characteristics get charted, at what frequency and with what response, is recorded in the control plan; what happens when a chart signals a real problem belongs to problem solving and 8D.
What to take away
- Control limits describe the process; specification limits state the requirement.
- Never plot specification limits on a control chart.
- Common cause needs a process change; special cause needs an investigation.
- Tampering measurably widens the output spread. React to signals, not points.
- Rational subgroups — consecutive parts, so shifts appear between subgroups.
- Poor subgrouping widens the limits and produces a chart that never signals.
- Use the run and trend rules; a mean can shift with no point out of limits.
- Recalculate limits only after a verified deliberate change.
- Cpk ≤ Cp always; the gap is an off-centre process.
- A Cpk-to-Ppk gap means setup, tool change and lot effects, not spread.
- Capability requires stability first, and a capable measurement system before that.
- Attribute charts signal late — variable data buys you the prevention window.
Check your understanding
10 questions. Nothing is recorded — this is just for you.