
Automotive
FMEA for design and process
The seven step AIAG-VDA method, why Action Priority replaced the RPN, how to tell a failure mode from an effect from a cause, and why a severity ranking is the one number you are not allowed to reduce.
Standards referencedAIAG-VDA FMEA HandbookIATF 16949IEC 60812ISO 31000VDA 6.3
An FMEA is not a form. It is an argument, conducted in a room, about what could go wrong with something that does not exist yet — and the form is only where the argument is recorded. Most bad FMEAs are bad because somebody filled in the form without holding the argument.

Failure mode, effect, cause — keep them apart
This is the discipline the whole method rests on, and the place most FMEAs go wrong in the first hour.
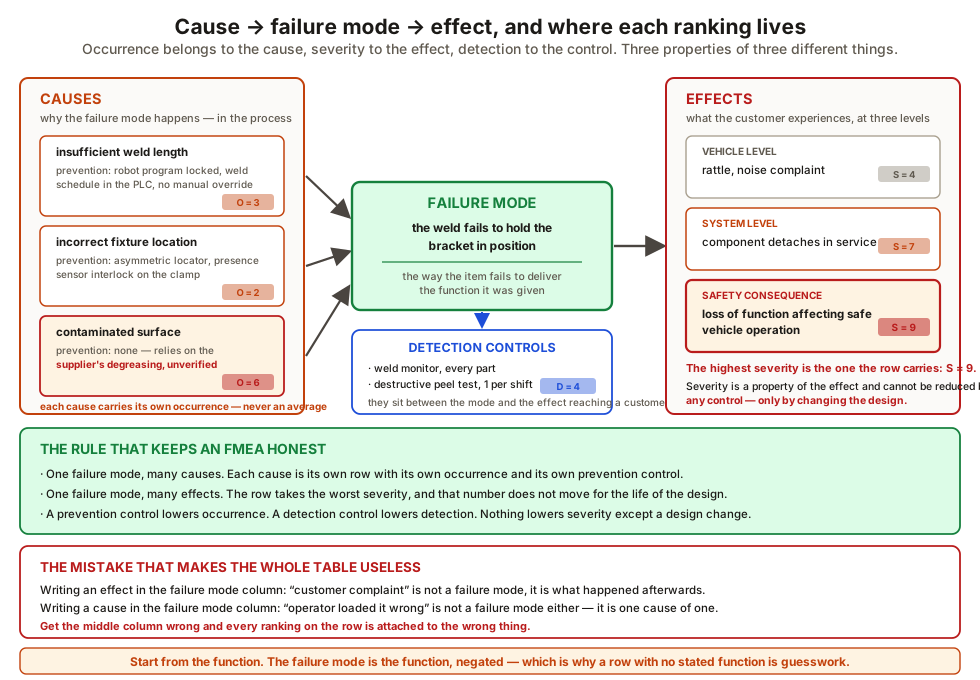
| Definition | Which ranking it carries | |
|---|---|---|
| Failure mode | How the item fails to deliver its function | — |
| Effect | The consequence, to the customer or next operation | Severity |
| Cause | Why the failure mode occurs | Occurrence |
| Control | What prevents the cause or detects the failure | Prevention → occurrence, Detection → detection |
Notice that the three rankings are properties of three different things. An occurrence number for a failure mode is meaningless, because one failure mode may have several causes of wildly different likelihood. Each cause is ranked on its own.
Severity is the number you cannot argue with
Seven steps, and the three that get skipped
| Step | Commonly | |
|---|---|---|
| 1 | Planning and preparation — scope, team, boundaries | Skipped |
| 2 | Structure analysis — break the item into elements | Skipped |
| 3 | Function analysis — state what each element must do | Skipped |
| 4 | Failure analysis — modes, effects, causes | Where people start |
| 5 | Risk analysis — rankings, controls, Action Priority | |
| 6 | Optimisation — actions, owners, verification | Half done |
| 7 | Results documentation | Done |
Steps 2 and 3 are what make the analysis complete rather than a brainstorm. You cannot enumerate the ways something fails to do its job until you have written down what its job is. Teams that start at step 4 produce a long list of the failures they happen to remember, which is not the same thing at all — and the gaps are invariably in the functions nobody articulated.
Action Priority, and why the RPN had to go
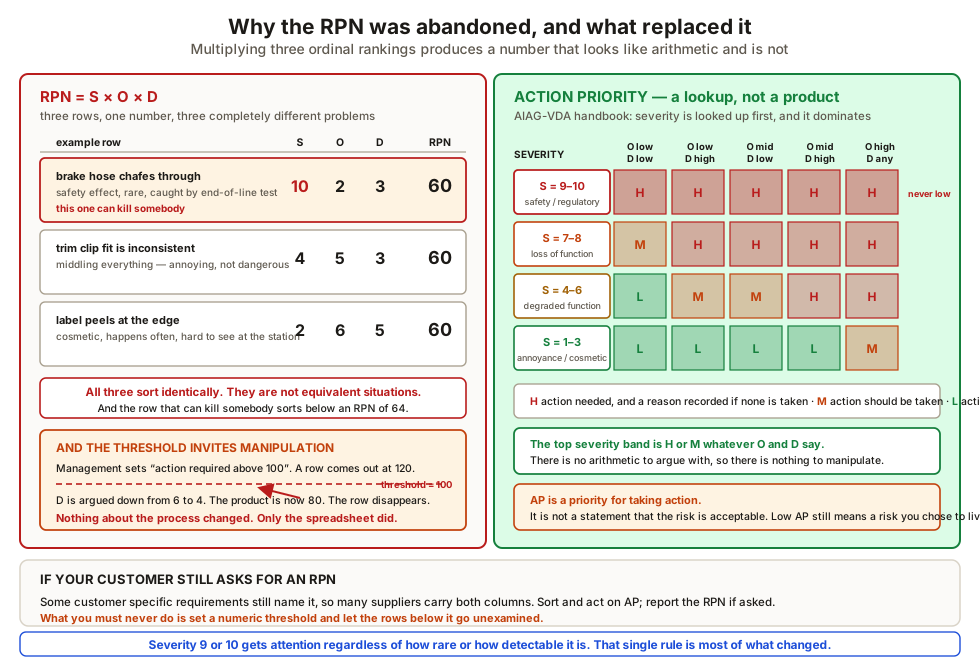
The RPN was the product of three rankings, and it had two fatal problems:
- Very different situations came out equal. Severity 10 with low occurrence and detection scored the same as three middling rankings. They are not the same situation.
- It invited manipulation. Where a threshold triggered mandatory action, teams learned to adjust occurrence or detection until the product fell below it. The FMEA then documented a decision not to act.
Action Priority replaces the multiplication with a defined lookup table in which severity always has primacy. A high severity item lands in high or medium priority regardless of the other two rankings, so it cannot be argued down.
One thing AP is often misread as: it indicates the priority for taking action, not whether the risk is acceptable. A low AP is not a statement that the risk is fine.
Design FMEA or process FMEA
| DFMEA | PFMEA | |
|---|---|---|
| Assumes | The part is made correctly | The design is correct |
| Asks | Can the design fail to perform? | What can the process do wrong? |
| Owned by | Product engineering | Manufacturing engineering |
| Feeds | Design verification plan | Control plan |
Mixing the two produces rows that neither function can act on — a process cause written against a design failure mode has no owner and no control that fits it.
Keeping it alive
An FMEA completed for the PPAP submission and never opened again has stopped being a risk analysis. It is a record of what was believed on one day.
Triggers for revision:
- A design or process change, including a supplier or material change.
- A failure in production or the field — and a field failure not in the FMEA is direct evidence the analysis was incomplete.
- A new application of an existing part.
- Lessons from another programme, which is what APQP phase five is for in APQP and new part introduction.
Special characteristics — the handover to the control plan
Where the FMEA identifies a characteristic whose variation significantly affects safety, fit, function or regulatory compliance, it becomes a special characteristic. It gets a symbol, and it is carried into the control plan with mandatory controls attached.
That handover is the point of the whole exercise. A special characteristic identified in the FMEA with no corresponding control plan entry is an identified risk that nothing is acting on — see control plans and process flow.
What to take away
- Keep failure mode, effect and cause distinct. Everything else depends on it.
- Occurrence belongs to the cause, severity to the effect, detection to the control.
- No inspection reduces severity. Only a design change does.
- Prevention lowers occurrence; detection lowers escape. Do not merge the columns.
- Steps 2 and 3 — structure and function — are what make the list complete.
- The RPN was dropped because it equated unlike situations and invited manipulation.
- Action Priority gives severity primacy, and indicates priority to act, not acceptability.
- DFMEA assumes good manufacture; PFMEA assumes good design. Do not mix them.
- A field failure absent from the FMEA proves the analysis was incomplete.
- Close actions on verified effectiveness, not on implementation.
- Special characteristics must arrive in the control plan, or the FMEA achieved nothing.
Check your understanding
10 questions. Nothing is recorded — this is just for you.