
Automotive
Oscilloscope and CAN waveform diagnosis
What a scope shows that a scan tool and a multimeter cannot, how a healthy CAN pair should look, the four faults that account for most bus problems, and why voltage drop beats resistance every time.
Standards referencedISO 11898-2ISO 11898-3SAE J1939-11
A scan tool tells you a controller stopped answering. It cannot tell you whether the controller died, its power failed, or the pair of wires between it and everything else acquired a fault. For that you have to look at the electricity.

Why a scope at all
A scan tool reports what a controller decided a signal meant — after filtering, after averaging, refreshed a few times a second. That is a summary, and summaries lose exactly the information you need.
The scope shows the signal itself. A dropout lasting forty microseconds, a slow edge caused by a high-resistance joint, ringing on a bus, noise riding on a sensor supply — all of them are invisible to a scan tool and all of them cause faults.
What a healthy CAN pair looks like

Recessive — both lines resting together at about 2.5 V. The difference is near zero.
Dominant — CAN high driven up to around 3.5 V, CAN low down to around 1.5 V. The difference is roughly 2 V.
The receiver looks only at the difference. That is the whole design. Interference coupling into a twisted pair arrives on both conductors almost equally, and subtracting one from the other removes it.
The measurement to make first
Ignition off, both connectors unplugged as required, measure across CAN high and CAN low: about 60 Ω.
Two 120 Ω terminators at opposite ends of the bus, in parallel. Roughly 120 Ω means one is missing or its branch is open. 60 Ω does not prove both are present and correctly placed — only that the parallel total works out.
The four faults worth recognising on sight
| Trace | Fault | Why it looks like that |
|---|---|---|
| Ringing and overshoot on every edge | Missing termination | The wave reflects from the unterminated end instead of being absorbed |
| One line pinned, the other still switching | Short to ground or to supply | The difference never reaches the dominant threshold |
| Rounded edges, reduced amplitude | High-resistance joint | The joint and the line capacitance form a slow filter |
| Clean bus, one node’s messages absent | A dead node, not a wiring fault | The bus is fine — the talker is not |
That last row is the reason to look. On a scan tool, a dead controller and a shorted bus produce identical symptoms. On a scope they look nothing alike, and the difference is an hour of work.
Other things the scope is for
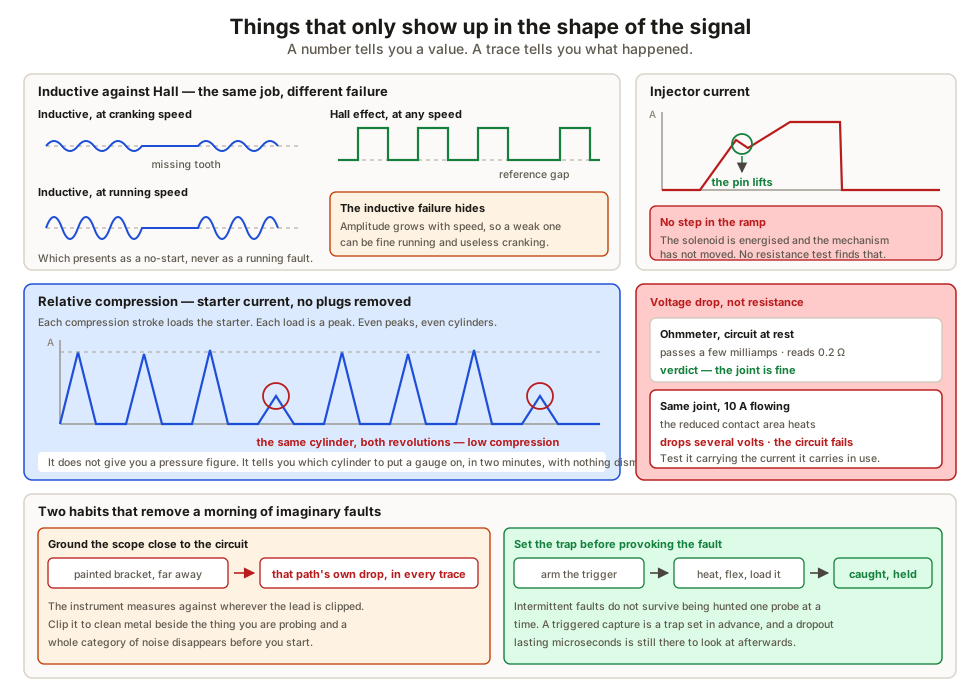
Crank and cam sensors. An inductive sensor produces an alternating waveform whose amplitude grows with speed, so one that is weak at cranking speed may be perfectly adequate once running — a fault that presents only as a no-start. A Hall sensor gives a clean square wave of constant amplitude at any speed.
Injector current. The current ramp has a small step in it where the pin lifts. If the ramp is smooth, the solenoid is energised and the mechanism has not moved. That is a distinction no resistance measurement can make.
Relative compression. Capture starter current across several revolutions. Each compression stroke loads the starter, and each load shows as a peak. Even peaks mean even cylinders; one noticeably low peak identifies the weak cylinder — without removing a spark plug.
Voltage drop, not resistance
An ohmmeter passes a few milliamps. A corroded joint will carry that happily and read a fraction of an ohm.
Put the circuit’s real current through the same joint and the small remaining contact area heats and drops voltage — often several volts. Measure across the connection while it is working, not while it is idle.
Two habits worth forming
Ground the scope close to the circuit under test. The instrument measures against wherever its ground lead is clipped. A painted bracket or a remote body point adds its own drop into every trace, and you will spend the morning chasing noise you created.
Set the trap before provoking the fault. Intermittent problems do not survive being hunted one probe at a time. Arm a trigger, start the capture, then heat the connector, flex the loom, load the circuit. A glitch lasting microseconds is caught and held, and you can look at it afterwards.
What to take away
- The scan tool gives a controller’s filtered opinion. The scope gives the signal.
- Recessive is both lines together near 2.5 V; dominant drives them apart to roughly 2 V of difference.
- The receiver reads only the difference, which is why the bus resists noise and why single-line faults are fatal.
- About 60 Ω across the pair — two 120 Ω terminators in parallel.
- Ringing means missing termination; a pinned line means a short; rounded edges mean resistance; a clean bus with one silent node means the node.
- Voltage drop under real current, never resistance at rest.
- Ground close, trigger first, then provoke the fault.
Next, the bench procedure where all of this meets a millimetre of tolerance — ADAS calibration, static and dynamic.
Check your understanding
10 questions. Nothing is recorded — this is just for you.