Instrumentation & Control
Reading a P&ID — the drawing every discipline works from
How a P&ID differs from a PFD, decoding instrument tags and bubbles, following a control loop across the sheet, and the details that decide what gets built.
Standards referencedISA 5.1IEC 62424ASME B31.3IEC 61511
Every discipline on a project eventually argues in front of the same drawing. The piping engineer, the instrument engineer, the process engineer, the operator and the safety specialist all point at it and say “but it says here”. That drawing is the P&ID.
Learning to read one is the highest-leverage skill on this site. It is also not taught — people absorb it by osmosis over a year or two, badly.
PFD first, P&ID second
A Process Flow Diagram (PFD) comes first. It shows the concept: major equipment, main streams, and a heat and mass balance. It answers what does this process do? It deliberately leaves out detail.
A Piping and Instrumentation Diagram (P&ID) is developed from it and answers what gets built? Everything is on it:
- every line, with its size, service, line number and class
- every valve, including small drains and vents
- every instrument, with its tag
- every interlock and trip
- equipment with its tag, and its key design data
- insulation and tracing codes, spec breaks, slopes, notes
The P&ID is the master reference. Isometrics, cable schedules, instrument index, cause-and- effect charts and operating procedures are all derived from it — which is why an error on a P&ID propagates into a dozen other documents before anyone notices.
Decoding a tag
The tag is the key to everything. It follows ISA 5.1.
PT - 1024
│    │
│    └── loop number, usually carrying the unit or area
└─────── what it is: P = pressure, T = transmitter
Read it in two halves: the first letter is the measured variable; the letters after it are the function.
| A | Analysis (composition) | Alarm |
|---|---|---|
| B | Burner or combustion | — |
| C | Conductivity | Controller |
| D | Density | Differential (as a modifier) |
| E | Voltage | Element — the primary sensor |
| F | Flow | Ratio (as a modifier) |
| G | Gauging or dimension | Glass or viewing device |
| H | Hand (manual) | High |
| I | Current | Indicator |
| J | Power | Scan |
| K | Time or schedule | Control station |
| L | Level | Light, or Low |
| M | Moisture or humidity | Middle or intermediate |
| P | Pressure | Point — a test connection |
| Q | Quantity | Totalise or integrate |
| R | Radiation | Recorder |
| S | Speed or frequency | Switch |
| T | Temperature | Transmitter |
| U | Multivariable | Multifunction |
| V | Vibration | Valve, damper or louvre |
| W | Weight or force | Well or probe |
| Y | Event or state | Relay, compute or convert |
| Z | Position or dimension | Driver or final actuator |
No rows match that filter.
An instrument tag is read in two halves. The FIRST letter says what is being measured; the letters that FOLLOW say what the device does about it. So PT is pressure transmitter, LIC is level indicating controller, and FAH is flow alarm high.
So, with practice, these read at a glance:
- PT-1024 — pressure transmitter
- LIC-2051 — level indicating controller
- FV-3010 — flow control valve
- TAH-4002 — temperature alarm, high
- PSHH-1030 — pressure switch, high high — a trip, not just an alarm
- ZSC-5006 — position switch, closed — valve closed confirmation
Bubbles say where the function lives
| Plain circle | Discrete instrument, mounted in the field | A pressure gauge on a line |
|---|---|---|
| Circle with a horizontal line | Discrete instrument, on the front of a main panel | A panel-mounted indicator |
| Circle with a dashed horizontal line | Discrete instrument, behind the panel — not operator accessible | A rear-of-panel relay |
| Circle inside a square | Shared display or control — a DCS function | A controller living in the DCS |
| Hexagon | Computer function | An advanced control calculation |
| Diamond inside a square | Programmable logic control (PLC) function | An interlock in the safety PLC |
| Solid line | Process line — the pipe itself | The main process flow |
| Thin solid line | Instrument process connection or impulse line | Tubing from tapping to transmitter |
| Dashed line | Electrical signal | 4–20 mA from a transmitter |
| Line with double crosshatches | Pneumatic signal | Air to a valve actuator |
| Line with small circles | Software or data link | Fieldbus or a DCS internal link |
| Line with X marks | Capillary tubing | A filled thermal system |
No rows match that filter.
The shape of the bubble tells you WHERE the function lives; the line into it tells you HOW the signal travels. Together they answer the question an operator cares about — can I see this from the control room, and what happens if the power or air fails?
The bubble shape answers a question an operator genuinely cares about: is this thing in the field, or can I see it from my chair? A plain circle means somebody has to walk out there. A circle in a square means it is on a DCS screen.
The line into the bubble says how the signal travels — solid for process, dashed for electrical, crosshatched for pneumatic. That matters for failure analysis: a pneumatic signal dies when instrument air is lost, an electrical one when power is lost, and those are different scenarios with different consequences.
Following a loop
Here is the skill. Take a loop number and trace it across the sheet.
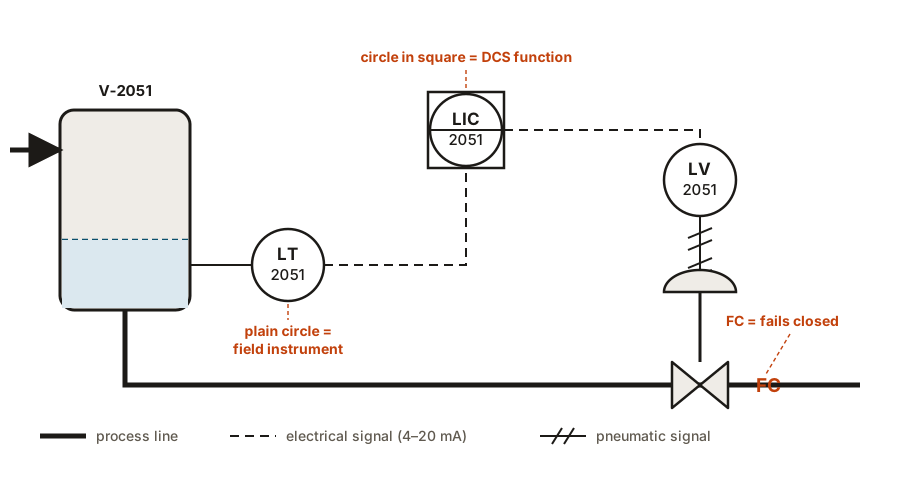
Take level control on a separator:
- LT-2051 — a level transmitter on the vessel, drawn as a field bubble, sends 4–20 mA.
- A dashed line runs to LIC-2051, drawn as a circle in a square — the controller lives in the DCS.
- Another dashed line leaves the controller to LV-2051, the control valve on the outlet.
- A crosshatched line from the bubble to the valve shows the pneumatic signal doing the final work.
- Beside the valve, FC — it fails closed.
One loop, one number, four symbols, and now you know what it does and what happens if the air fails. Separately you may find LAHH-2051 driving a trip through the safety system — same measurement, different and independent protective function.
The details people skip
Line numbers carry the size, service, sequential number and line class — the document covered in reading a line class. Everything the line is made of is settled by those few characters.
Spec breaks are marked where the class changes, and the position matters. Which side a valve sits on is a real decision, not a drafting artefact.
Slopes are annotated where a line must drain or must not pocket liquid. That is a construction instruction, and one commonly lost between drawing and site.
Insulation and tracing codes say whether a line is insulated for heat conservation, personnel protection, or cold service, and whether it is steam or electrically traced.
Utility connections — the small hose points for nitrogen, air and steam that appear trivial on the drawing and matter enormously during commissioning and turnaround.
Notes and revision clouds. The clouds show what changed at the last revision. On a live project they are the first thing to read, because they are what you do not yet know.
Reading one in anger
Two situations where a P&ID is used seriously, and where good reading habits are formed:
HAZOP. A team works through the drawing node by node, applying guide words — no flow, more pressure, reverse flow, less level — and asks what would cause it, what the consequence is, and whether the existing protection is adequate. Almost every trip, relief valve and fail position on a plant exists because a HAZOP team asked that question. It is also the best way to learn to read a P&ID properly, because you cannot bluff it.
Isolation planning. Before anyone breaks into a line, the P&ID is used to establish where the isolation points are and whether they give double block and bleed. If the drawing is wrong, the isolation plan is wrong — which is why as-built accuracy is a safety matter and not a paperwork one.
What to take away
- PFD answers what the process does; P&ID answers what gets built.
- It is schematic. Only relative elevation means anything; never scale it.
- Tags read in two halves — first letter is the measurement, the rest is the function.
- Bubble shape says where the function lives; line style says how the signal travels.
- Trace loops by number. One number tells you the measurement, the controller, the final element and the fail position.
- Control and protection should use independent elements.
- Read the revision clouds first, and treat an out-of-date P&ID as a safety problem.
Check your understanding
10 questions. Nothing is recorded — this is just for you.